在安装完 JDK 之后,会自带安装一些常用的小工具,而 jmap 就是其中一个比较常用的。jmap 打印给定进程、core file 或远程调试服务器的共享对象内存映射或堆内存细节。我们可以查看下 jmap 的命令使用:
iteblog@iteblog.com:~|⇒  jmap
Usage:
    jmap [option] <pid>
        (to connect to running process)
    jmap [option] <executable <core>
        (to connect to a core file)
    jmap [option] [server_id@]<remote server IP or hostname>
        (to connect to remote debug server)

where <option> is one of:
    <none>               to print same info as Solaris pmap
    -heap                to print java heap summary
    -histo[:live]        to print histogram of java object heap; if the "live"
                         suboption is specified, only count live objects
    -clstats             to print class loader statistics
    -finalizerinfo       to print information on objects awaiting finalization
    -dump:<dump-options> to dump java heap in hprof binary format
                         dump-options:
                           live         dump only live objects; if not specified,
                                        all objects in the heap are dumped.
                           format=b     binary format
                           file=<file>  dump heap to <file>
                         Example: jmap -dump:live,format=b,file=heap.bin <pid>
    -F                   force. Use with -dump:<dump-options> <pid> or -histo
                         to force a heap dump or histogram when <pid> does not
                         respond. The "live" suboption is not supported
                         in this mode.
    -h | -help           to print this help message
    -J<flag>             to pass <flag> directly to the runtime system
Usage 那里面显示的正好就是给定进程、core file 或远程调试服务器。option 里面的解释如下:
- <none>: 查看进程的内存映像信息,这个和 Solaris 的 pmap 命令含义一样。
- -heap:显示 Java 堆详细信息
- -histo[:live]:打印 Java 对象堆的直方图;如果指定了 "live" 子选项,则只计数活动对象
- -clstats:打印类加载统计信息;
- -finalizerinfo:打印等待结束处理的对象的信息
- -dump:<dump-options>:以 hprof 二进制格式转储 Java 堆信息;
- -F:与 -dump:<dump-options> <pid> 或 -histo 一起使用以在 <pid> 没有响应时强制进行堆 dump 或直方图。 此模式不支持“live”子选项。
- -h | -help:打印帮助信息。
- -J<flag>:将 flag 信息直接传递给 runtime system。
下面我们来看看每种选项的使用。
不指定参数
也就是直接查看进程的内存映像信息,这个和 Solaris 的 pmap 命令含义一样。如下:
iteblog@iteblog.com:~|⇒ jmap 1882
Attaching to process ID 1882, please wait...
Debugger attached successfully.
Server compiler detected.
JVM version is 25.91-b15
0x0000000000400000      8K      /jdk8/bin/java
0x00007fb7c1605000      8K      /jdk8/jre/lib/amd64/libjaas_unix.so
0x00007fb86256e000      86K     /usr/lib64/libgcc_s-4.8.5-20150702.so.1
0x00007fb862784000      276K    /jdk8/jre/lib/amd64/libsunec.so
0x00007fb9a0e83000      91K     /jdk8/jre/lib/amd64/libnio.so
0x00007fb9a1354000      103K    /usr/lib64/libresolv-2.17.so
0x00007fb9a156d000      30K     /usr/lib64/libnss_dns-2.17.so
0x00007fb9a197a000      110K    /jdk8/jre/lib/amd64/libnet.so
0x00007fb9a1bee000      50K     /jdk8/jre/lib/amd64/libmanagement.so
0x00007fba01f88000      124K    /jdk8/jre/lib/amd64/libzip.so
0x00007fba021a4000      60K     /usr/lib64/libnss_files-2.17.so
0x00007fba023b7000      50K     /jdk8/jre/lib/amd64/libinstrument.so
0x00007fba025c2000      226K    /jdk8/jre/lib/amd64/libjava.so
0x00007fba027f1000      64K     /jdk8/jre/lib/amd64/libverify.so
0x00007fba02a00000      42K     /usr/lib64/librt-2.17.so
0x00007fba02c08000      1110K   /usr/lib64/libm-2.17.so
0x00007fba02f0a000      16645K  /jdk8/jre/lib/amd64/server/libjvm.so
0x00007fba03ef3000      2101K   /usr/lib64/libc-2.17.so
0x00007fba042c0000      18K     /usr/lib64/libdl-2.17.so
0x00007fba044c4000      106K    /jdk8/lib/amd64/jli/libjli.so
0x00007fba046dc000      138K    /usr/lib64/libpthread-2.17.so
0x00007fba048f8000      159K    /usr/lib64/ld-2.17.so
-heap 参数
-heap 参数显示 Java 堆详细信息,包括 GC 算法,堆的配置信息以及各个区域内存使用的情况。
iteblog@iteblog.com:~|⇒ jmap -heap 1882
Attaching to process ID 1882, please wait...
Debugger attached successfully.
Server compiler detected.
JVM version is 25.91-b15

using thread-local object allocation.
Garbage-First (G1) GC with 4 thread(s)

Heap Configuration:
   MinHeapFreeRatio         = 40
   MaxHeapFreeRatio         = 70
   MaxHeapSize              = 6442450944 (6144.0MB)
   NewSize                  = 1363144 (1.2999954223632812MB)
   MaxNewSize               = 2147483648 (2048.0MB)
   OldSize                  = 5452592 (5.1999969482421875MB)
   NewRatio                 = 2
   SurvivorRatio            = 4
   MetaspaceSize            = 134217728 (128.0MB)
   CompressedClassSpaceSize = 528482304 (504.0MB)
   MaxMetaspaceSize         = 536870912 (512.0MB)
   G1HeapRegionSize         = 16777216 (16.0MB)

Heap Usage:
G1 Heap:
   regions  = 384
   capacity = 6442450944 (6144.0MB)
   used     = 434227648 (414.11175537109375MB)
   free     = 6008223296 (5729.888244628906MB)
   6.740100185076396% used
G1 Young Generation:
Eden Space:
   regions  = 21
   capacity = 553648128 (528.0MB)
   used     = 352321536 (336.0MB)
   free     = 201326592 (192.0MB)
   63.63636363636363% used
Survivor Space:
   regions  = 1
   capacity = 16777216 (16.0MB)
   used     = 16777216 (16.0MB)
   free     = 0 (0.0MB)
   100.0% used
G1 Old Generation:
   regions  = 5
   capacity = 1040187392 (992.0MB)
   used     = 65128896 (62.11175537109375MB)
   free     = 975058496 (929.8882446289062MB)
   6.261265662408644% used

43983 interned Strings occupying 4509144 bytes.
-histo[:live] 参数
这个命令用于打印 Java 对象堆的直方图。使用如下:
iteblog@iteblog.com:~|⇒ jmap -histo 1882
 num     #instances         #bytes  class name
----------------------------------------------
   1:        421843       70270576  [C
   2:        121928       54984176  [I
   3:        131897       27709024  [B
   4:        100396       12022896  [Ljava.lang.Object;
   5:          7083        7069216  [D
   6:        231888        5565312  java.lang.String
   7:        128217        4102944  java.util.HashMap$Node
   8:          3705        3556400  [J
   9:         13104        3239920  [Z
  10:         99064        3170048  java.util.concurrent.ConcurrentHashMap$Node
clstats 参数
这个是打印类加载统计信息。对于每个类加载器而言,它的名称,活跃度,地址,父类加载器,它所加载的类的数量和大小都会被打印。此外,包含的字符串数量和大小也会被打印。使用如下:
iteblog@iteblog.com:~|⇒ jmap -clstats 1882
Attaching to process ID 1882, please wait...
Debugger attached successfully.
Server compiler detected.
JVM version is 25.91-b15
finding class loader instances ..done.
computing per loader stat ..done.
please wait.. computing liveness.................liveness analysis may be inaccurate ...
class_loader    classes bytes   parent_loader   alive?  type

<bootstrap>     3684    6352722   null          live    <internal>
0x0000000721c0adc0      1       880       null          dead    sun/reflect/DelegatingClassLoader@0x00000007e000a028
0x0000000723601760      1       880     0x000000072052b498      dead    sun/reflect/DelegatingClassLoader@0x00000007e000a028
0x0000000723607b60      1       880     0x000000072052b498      dead    sun/reflect/DelegatingClassLoader@0x00000007e000a028
0x0000000724c810c8      1       1472      null          dead    sun/reflect/DelegatingClassLoader@0x00000007e000a028
0x00000007223a1638      1       1472    0x000000072052b498      dead    sun/reflect/DelegatingClassLoader@0x00000007e000a028
0x0000000725933590      1       1483    0x000000072052b498      dead    sun/reflect/DelegatingClassLoader@0x00000007e000a028
0x0000000720e758e0      1       880     0x000000072052b498      dead    sun/reflect/DelegatingClassLoader@0x00000007e000a028
0x0000000724a7e4a0      1       1473    0x000000072052b498      dead    sun/reflect/DelegatingClassLoader@0x00000007e000a028
0x0000000723603768      1       880     0x000000072052b498      dead    sun/reflect/DelegatingClassLoader@0x00000007e000a028
0x0000000723609b68      1       1471    0x000000072052b498      dead    sun/reflect/DelegatingClassLoader@0x00000007e000a028
0x00000007260ac600      1       880     0x000000072052b498      dead    sun/reflect/DelegatingClassLoader@0x00000007e000a028
0x00000007254c2540      1       1471      null          dead    sun/reflect/DelegatingClassLoader@0x00000007e000a028
finalizerinfo 参数
打印等待回收的对象信息。
iteblog@iteblog.com:~|⇒ jmap -finalizerinfo 1882
Attaching to process ID 1882, please wait...
Debugger attached successfully.
Server compiler detected.
JVM version is 25.91-b15
Number of objects pending for finalization: 0
Number of objects pending for finalization: 0 说明当前 F-Queue 队列中并没有等待 Finalizer 线程执行 finalizer 方法的对象。
dump 参数
以 hprof 二进制格式转储 Java 堆信息。这个命令比较常用,比如我们查看内存泄露就可以使用这个命令。使用如下:
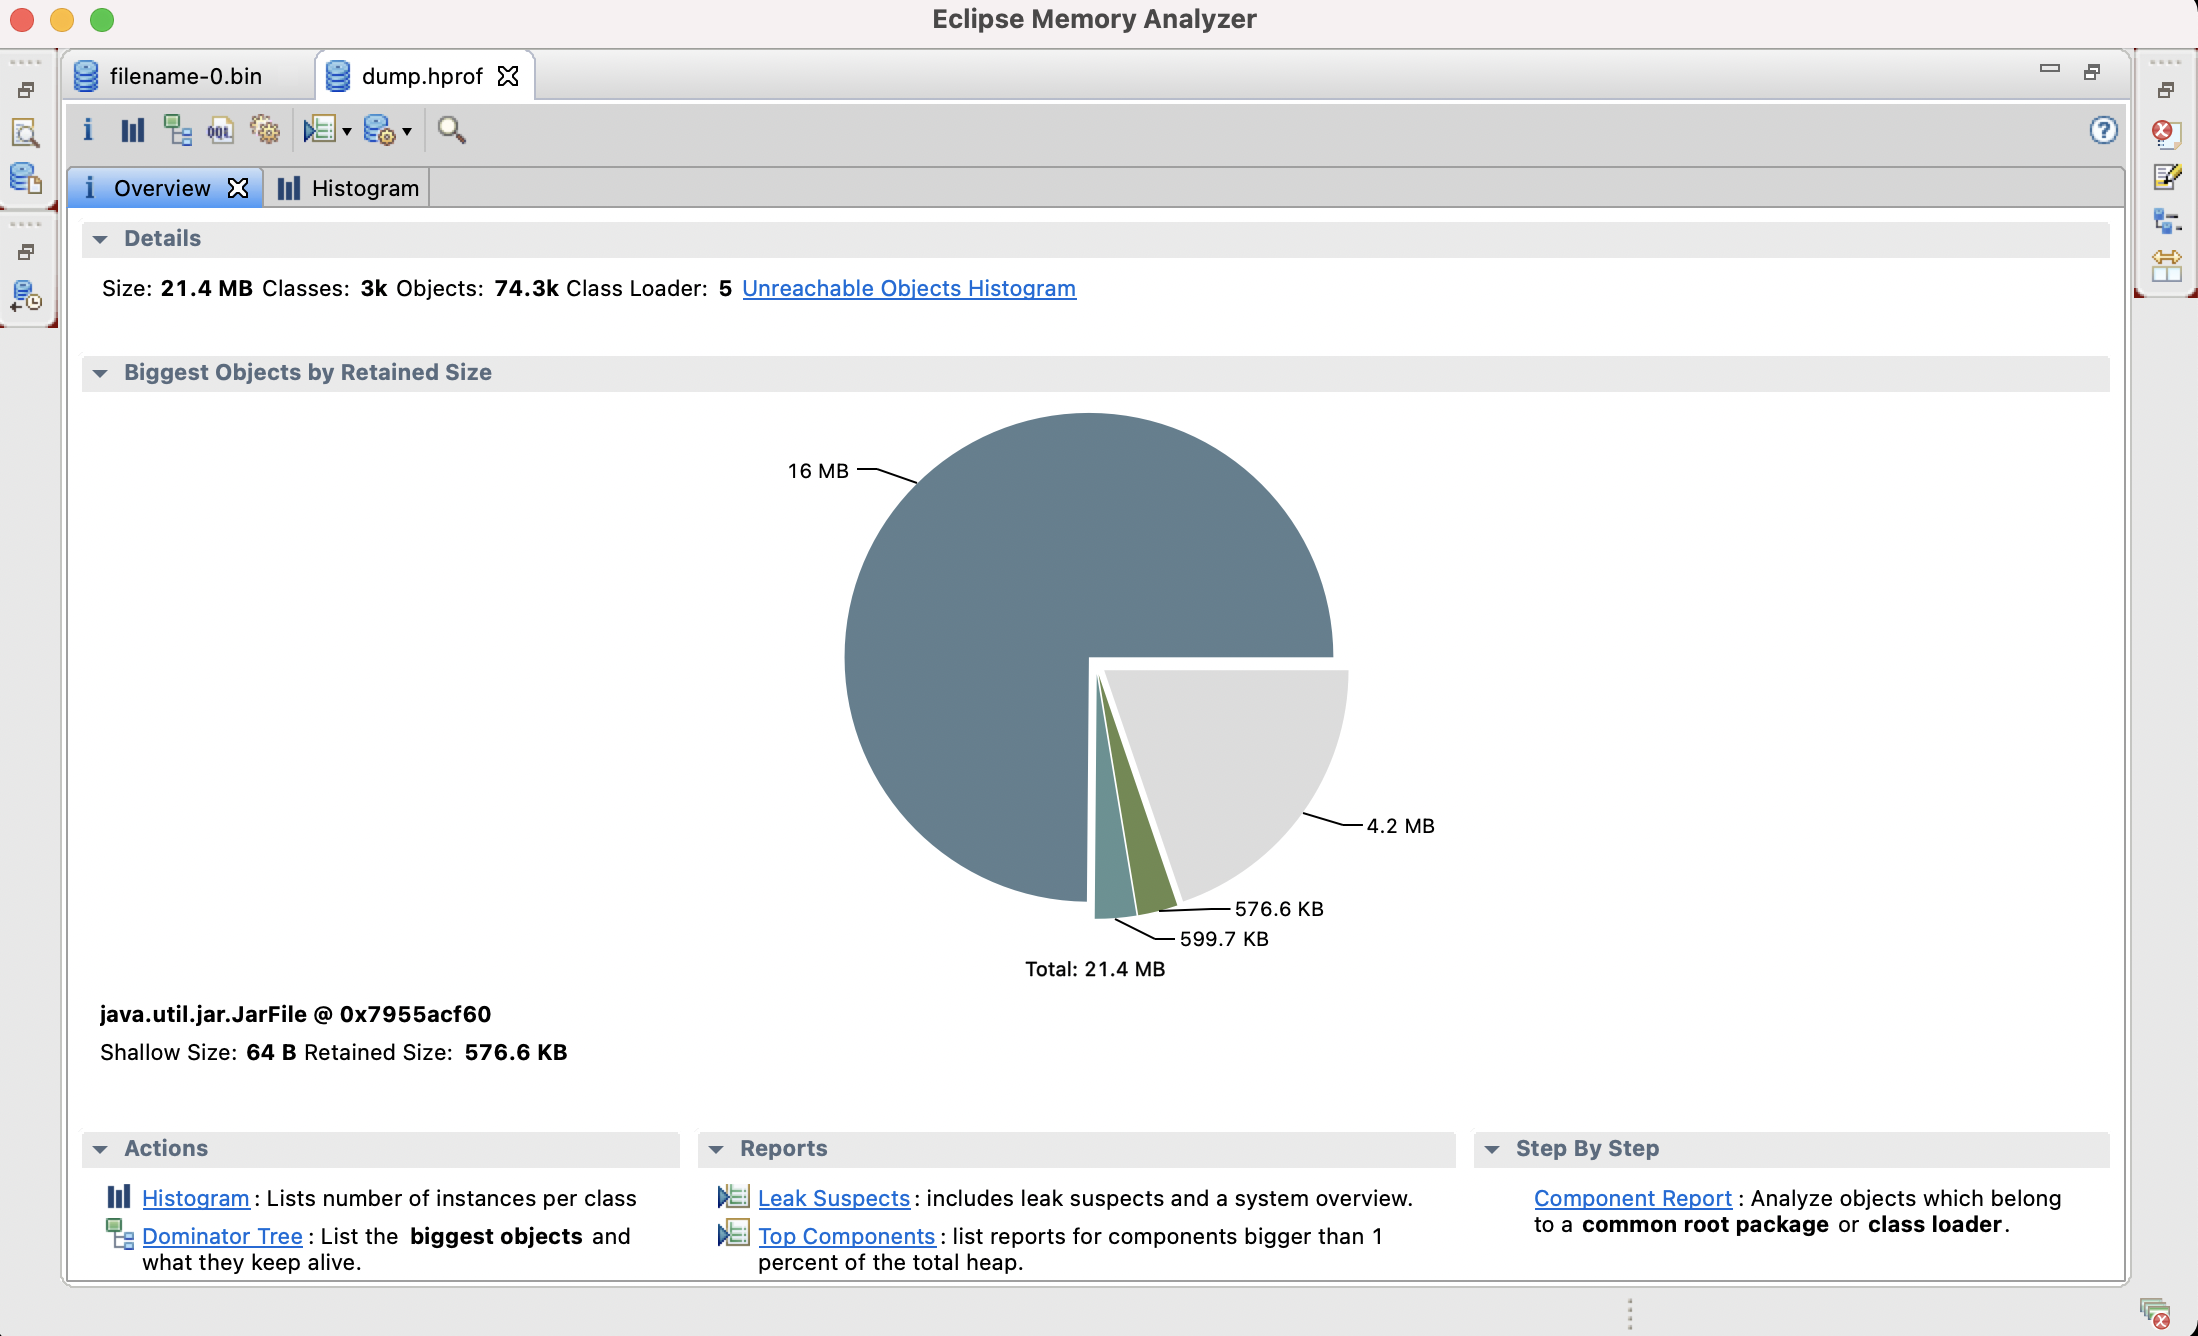
iteblog@iteblog.com:~|⇒jmap -dump:format=b,file=filename.bin  1882
Dumping heap to /home/iteblog/filename.bin ...
Heap dump file created
生成了 filename.bin 文件只会,我们可以使用 Eclipse Memory Analyzer(MAT, https://www.eclipse.org/mat/)来分析内存的占用情况。
如果想及时了解Spark、Hadoop或者HBase相关的文章,欢迎关注微信公众号:过往记忆大数据
原创文章版权归过往记忆大数据(过往记忆)所有,未经许可不得转载。
本文链接: 【Java 中的 jmap 使用介绍】(https://www.iteblog.com/archives/9976.html)