
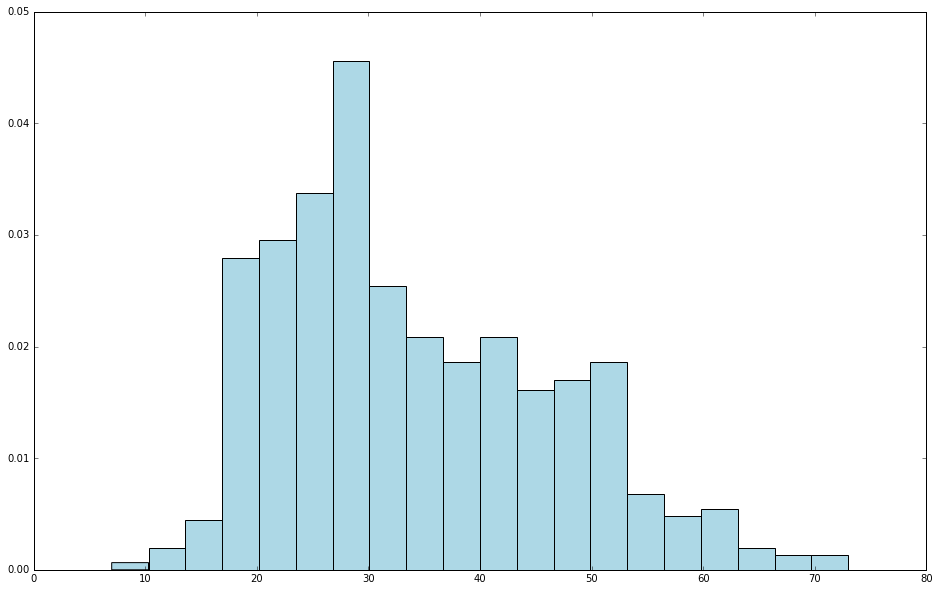
最近在使用 Python 学习 Spark,使用了 jupyter notebook,期间使用到 hist 来绘图,代码很简单如下:
user_data = sc.textFile("/home/iteblog/ml-100k/u.user")
user_fields = user_data.map(lambda line: line.split("|"))
ages = user_fields.map(lambda x: int(x[1])).collect()
hist(ages, bins=20, color='lightblue', normed=True)
fig = matplotlib.pyplot.gcf()
fig.set_size_inches(16, 10)
但是运行上面的代码出现了下面的异常:
NameError                                 Traceback (most recent call last)
<ipython-input-3-d8f604ee7567> in <module>()
      2
      3 ages = user_fields.map(lambda x: int(x[1])).collect()
----> 4 hist(ages, bins=20, color='lightblue', normed=True)
      5 fig = matplotlib.pyplot.gcf()
      6 fig.set_size_inches(16, 10)

NameError: name 'hist' is not defined
看上面的错误就知道是因为没有引入 hist 所在的类库导致的,我们假设相关依赖,如下:
from matplotlib.pylab import *
然后再运行,出现了以下的异常:
---------------------------------------------------------------------------
RuntimeError                              Traceback (most recent call last)
<ipython-input-4-455263756c5d> in <module>()
      2
      3 ages = user_fields.map(lambda x: int(x[1])).collect()
----> 4 hist(ages, bins=20, color='lightblue', normed=True)
      5 fig = matplotlib.pyplot.gcf()
      6 fig.set_size_inches(16, 10)

/user/iteblog/anaconda/lib/python2.7/site-packages/matplotlib/pyplot.pyc in hist(x, bins, range, normed, weights, cumulative, bottom, histtype, align, orientation, rwidth, log, color, label, stacked, hold, data, **kwargs)
   2945          rwidth=None, log=False, color=None, label=None, stacked=False,
   2946          hold=None, data=None, **kwargs):
-> 2947     ax = gca()
   2948     # allow callers to override the hold state by passing hold=True|False
   2949     washold = ax.ishold()

/user/iteblog/anaconda/lib/python2.7/site-packages/matplotlib/pyplot.pyc in gca(**kwargs)
    926     matplotlib.figure.Figure.gca : The figure's gca method.
    927     """
--> 928     return gcf().gca(**kwargs)
    929
    930 # More ways of creating axes:

/user/iteblog/anaconda/lib/python2.7/site-packages/matplotlib/pyplot.pyc in gcf()
    576         return figManager.canvas.figure
    577     else:
--> 578         return figure()
    579
    580

/user/iteblog/anaconda/lib/python2.7/site-packages/matplotlib/pyplot.pyc in figure(num, figsize, dpi, facecolor, edgecolor, frameon, FigureClass, **kwargs)
    525                                         frameon=frameon,
    526                                         FigureClass=FigureClass,
--> 527                                         **kwargs)
    528
    529         if figLabel:

/user/iteblog/anaconda/lib/python2.7/site-packages/matplotlib/backends/backend_qt4agg.pyc in new_figure_manager(num, *args, **kwargs)
     44     FigureClass = kwargs.pop('FigureClass', Figure)
     45     thisFig = FigureClass(*args, **kwargs)
---> 46     return new_figure_manager_given_figure(num, thisFig)
     47
     48

/user/iteblog/anaconda/lib/python2.7/site-packages/matplotlib/backends/backend_qt4agg.pyc in new_figure_manager_given_figure(num, figure)
     51     Create a new figure manager instance for the given figure.
     52     """
---> 53     canvas = FigureCanvasQTAgg(figure)
     54     return FigureManagerQT(canvas, num)
     55

/user/iteblog/anaconda/lib/python2.7/site-packages/matplotlib/backends/backend_qt4agg.pyc in __init__(self, figure)
     74         if DEBUG:
     75             print('FigureCanvasQtAgg: ', figure)
---> 76         FigureCanvasQT.__init__(self, figure)
     77         FigureCanvasQTAggBase.__init__(self, figure)
     78         FigureCanvasAgg.__init__(self, figure)

/user/iteblog/anaconda/lib/python2.7/site-packages/matplotlib/backends/backend_qt4.pyc in __init__(self, figure)
     66         if DEBUG:
     67             print('FigureCanvasQt qt4: ', figure)
---> 68         _create_qApp()
     69
     70         # Note different super-calling style to backend_qt5

/user/iteblog/anaconda/lib/python2.7/site-packages/matplotlib/backends/backend_qt5.pyc in _create_qApp()
    136                 display = os.environ.get('DISPLAY')
    137                 if display is None or not re.search(':\d', display):
--> 138                     raise RuntimeError('Invalid DISPLAY variable')
    139
    140             qApp = QtWidgets.QApplication([str(" ")])

RuntimeError: Invalid DISPLAY variable
上面的错误如果正常情况下,我们可以通过引入下面的类库解决:
matplotlib.use('Agg')
但是我们是在 jupyter notebook 上运行上面的代码,所以这个解决不了我们的问题。搜索了好久,终于找到如何解决了,我们可以在代码的最上面加入下面的代码:
%matplotlib inline
然后再运行,我们终于可以看到图形了。如下:
顺便贴下网上找到的关于 %matplotlib inline 的描述:%matplotlib inline works on Jupyter notebook. It makes matplotlib plot on notebook itself, instead of a DEVICE。
原创文章版权归过往记忆大数据(过往记忆)所有,未经许可不得转载。
本文链接: 【Spark + jupyter notebook出现图像无法显示问题解决】(https://www.iteblog.com/archives/2295.html)